
Denials are a big part of the problem. MGMA's Practice Operations report found a first-submission denial rate of nearly 8% among single-specialty practices, meaning roughly one in twelve claims bounces back before a dollar reaches the bank.
Tracking the right medical billing KPIs turns that guesswork into a system you can actually manage. Instead of reacting to cash flow surprises, you catch revenue leaks early enough to fix them. Here's what to track, what "good" looks like, and how to act on the data.
Key Takeaways
- Clean claims rate, denial rate, and days in A/R together reveal the clearest picture of revenue cycle health
- Weekly reviews of denials and A/R aging catch revenue leakage before it compounds into a cash flow crisis
- Benchmarks shift by specialty, payer mix, and practice size — context matters more than one "perfect" number
- Specialized billing partners often move these metrics within 30-60 days of onboarding
Overview of Medical Billing KPIs in Revenue Cycle Management
Medical billing KPIs are trackable metrics that show how efficiently a practice submits claims, collects payments, and manages outstanding balances.
They're the difference between "billing feels off this month" and "our clean claims rate dropped six points because of a coding issue with one specific payer."
Every claim submitted, every payment posted, and every denial received generates data. The real question is whether anyone's turning that data into decisions.
More practices are deciding not to answer that question alone. In a late-2024 MGMA poll, 36% of medical practice leaders said their organization planned to outsource or automate part of its revenue cycle management in 2025. That's more than a third of practices admitting their current billing oversight isn't keeping pace.
Billing has grown more complex while front-office bandwidth hasn't kept up. Practices now juggle:
- More payers with different rules
- Stricter prior authorization requirements
- Rising patient financial responsibility
Not every KPI deserves equal attention. The metrics below have the most direct, measurable impact on cash flow and profitability.
Top Medical Billing KPIs Every Practice Should Track
These KPIs made the list because they're measurable from standard EHR and practice management data, tie directly to cash flow, and have benchmarks recognized across the industry. Vanity metrics didn't make the cut.
Clean Claims Rate
This is the percentage of claims accepted and paid on first submission, with no errors, rejections, or need for resubmission. It's the leading indicator of billing process quality. A low rate almost always predicts trouble in denial rate and A/R down the line.
| Metric | Detail |
|---|---|
| How to Calculate | Clean claims ÷ total claims submitted × 100 |
| Industry Benchmark | Around 98%, per Becker's ASC Review |
| Red Flag Threshold | Consistently below 90% often points to coding errors, eligibility gaps, or documentation issues |
Persistex maintains a 98% clean claim rate across its client base by pairing AAPC-certified coders with real-time eligibility checks before claims ever go out.

Denial Rate
Denial rate is the percentage of submitted claims a payer rejects. Every denial is either delayed revenue or lost revenue, depending on how fast your team appeals it.
| Metric | Detail |
|---|---|
| How to Calculate | Denied claims ÷ total claims submitted × 100 |
| Industry Benchmark | Under 10% is a solid target; under 5% is stronger, per AAPC |
| Common Causes | Eligibility errors, missing prior authorization, coding mismatches, untimely filing |
Net Collection Rate
This shows the percentage of collectible revenue you actually receive after contractual adjustments. It's the truest measure of collections efficiency because it accounts for what payers were ever going to pay in the first place.
| Metric | Detail |
|---|---|
| How to Calculate | (Payments received ÷ (charges − contractual adjustments)) × 100 |
| Industry Benchmark | 95%+ is considered strong; high performers exceed 99% |
| What a Low Rate Signals | Underpayments going unnoticed, excessive write-offs, or a weak appeals process |
Gross Collection Rate
Gross collection rate divides total payments by total charges billed. Unlike net collection rate, it doesn't factor in contractual adjustments, which makes it easy to misread.
| Metric | Detail |
|---|---|
| How to Calculate | Total payments ÷ total charges × 100 |
| Use Case | Best for spotting high-level trends over time, not evaluating precise performance |
| Limitation | Can look artificially low or high since it ignores payer-specific adjustments |
Days in Accounts Receivable (A/R)
Days in A/R tracks the average number of days it takes to collect payment after a claim goes out. This number has a direct line to cash flow: the longer it climbs, the tighter money gets.
| Metric | Detail |
|---|---|
| How to Calculate | Total A/R ÷ average daily charges |
| Industry Benchmark | 40-50 days is standard; anything past 60 days signals a below-average process, per AAPC |
| Related Metric | Track the percentage of A/R aged past 90 days as a companion figure |
Charge Lag (Claim Lag Time)
Charge lag measures the time between a patient encounter and when the claim actually goes out the door. Everything downstream (reimbursement speed, denial risk, and cash flow) starts here.
| Metric | Detail |
|---|---|
| How to Calculate | Average days between date of service and claim submission date |
| Target to Watch | Many high-performing practices aim to submit within a day or two of the visit |
| Why It's an Early Warning Sign | Rising lag often signals staffing bottlenecks or documentation delays before other KPIs show the damage |
Patient Collection Rate
Patient collection rate tracks the share of patient-owed balances (co-pays, deductibles, and coinsurance) a practice actually collects. As patient financial responsibility keeps climbing, this KPI matters more every year.
| Metric | Detail |
|---|---|
| How to Calculate | Patient payments collected ÷ total patient balance owed × 100 |
| Reasonable Target | Many practices aim for 70-80% collected |
| Improvement Levers | Upfront eligibility verification, cost estimates before service, and online payment options |
Bad Debt Rate
Bad debt rate is the share of billed charges written off as uncollectible. Some bad debt is unavoidable. A rising rate over several quarters, however, usually signals a process failure somewhere upstream.
| Metric | Detail |
|---|---|
| How to Calculate | Total bad debt written off ÷ total charges × 100 |
| Reasonable Target | Keep it as low as possible; most healthy practices work to keep write-offs a small fraction of expected collections |
| Prevention Tactics | Upfront collections, thorough insurance verification, and flexible payment plans |
How to Choose the Right KPIs for Your Practice
Not every practice should chase the same numbers. Specialty is the first filter. Behavioral health practices and other prior-authorization-heavy specialties need to weight authorization approval rates and payer-specific denial trends more heavily than a primary care office would, since documentation and authorization requirements are stricter.
Practice size and growth stage change the priority list too:
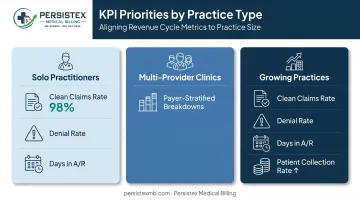
- Solo practitioners: Focus on three core KPIs: clean claims rate, denial rate, and days in A/R.
- Multi-provider clinics: Track payer-stratified breakdowns, since one payer's performance can mask another's problems.
- Growing practices: Add patient collection rate as volume and patient financial responsibility both rise.
The most common mistake? Tracking a dozen metrics without benchmarks or action plans attached to any of them. That's data overload—and it rarely improves revenue. Pick fewer KPIs, define what "good" looks like for each, and assign someone to act on what the numbers show.
Turning KPI Data Into Actionable Revenue Growth
Numbers on a dashboard don't fix anything by themselves. What matters is the review cadence and what happens after you spot a problem.
Review frequency matters more than most practices realize:
- Monthly: Review core KPIs (clean claims rate, net collection rate, patient collection rate) as a full set.
- Weekly: Check denial rate and A/R aging specifically, since these can slip past timely filing deadlines fast.
- Immediately: Act on any denial spike tied to a single payer or code before it becomes a pattern.
Root-cause denial tracking is what separates a static report from an action plan. Tagging every denial to a specific payer, code, or documentation gap tells you exactly what to fix: a coding issue, an eligibility gap, or a difficult payer.
Most practices don't have the bandwidth or specialty coding depth to keep this up consistently. That is the gap Persistex Medical Billing fills.
Persistex pairs real-time, transparent dashboards with CPC/CPB-certified coders and named account teams (not rotating call center staff) for behavioral health, family medicine, primary care, pediatric, chiropractic, and podiatry practices.
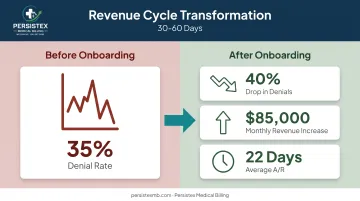
One eight-provider behavioral health clinic came to Persistex with a 35% denial rate and inconsistent cash flow. After onboarding, denials dropped 40%, monthly revenue rose by $85,000, and average A/R fell to 22 days. With a steady review cadence and root-cause follow-up, results like these typically show up within 30 to 60 days of onboarding.
Conclusion
Consistent, benchmarked KPI tracking is what separates practices with predictable revenue from those losing money despite steady patient volume. The gap between the two usually isn't patient demand. It's whether anyone's watching the numbers closely enough to catch problems early.
Pull up your current billing reports and check them against the KPIs covered here. Pick 2-3 that need immediate attention and start there.
If you'd rather have a second set of eyes on it, Persistex Medical Billing offers a free revenue cycle assessment to benchmark your current KPI performance and flag where revenue is leaking.
Frequently Asked Questions
What are the 5 key medical billing metrics?
Most practices should start with clean claims rate, denial rate, net collection rate, days in A/R, and charge lag. Together, these five cover claim quality, payer responsiveness, and cash flow speed.
What is a good clean claims rate for a medical practice?
Industry data points to around 98% as a strong clean claims rate. Falling much below 90% usually indicates coding errors, eligibility issues, or documentation gaps that need attention.
How often should practices review medical billing KPIs?
Review core KPIs monthly at minimum, but check denial rate and A/R aging weekly. Weekly checks catch problems before they age past timely filing deadlines.
What is considered a healthy denial rate in medical billing?
AAPC considers under 10% a good target, with under 5% considered strong. Common causes of elevated rates include eligibility errors, missing prior authorization, and coding mismatches.
How can medical billing KPIs help reduce claim denials?
Root-cause denial tracking tags each denial to a specific payer, code, or documentation gap. That turns raw data into a fixable pattern instead of a static monthly report.
What's the difference between gross collection rate and net collection rate?
Gross collection rate measures payments against total charges billed, while net collection rate accounts for contractual adjustments. Net collection rate is the more accurate indicator of true collections performance.