
Many practices lose money in these gaps without ever knowing where it went. Behavioral health and TMS practices face this problem even more acutely — frequent recurring sessions, strict prior authorization requirements, and complex CPT coding create more points of failure than a typical primary care visit.
This guide breaks down the 10 revenue cycle metrics every practice, from solo providers to multi-provider clinics, should track. You'll get formulas, benchmarks, and practical steps to improve each one.
Key Takeaways
- Revenue cycle metrics expose exactly where claims, cash flow, and collections break down before they become a crisis
- Days in AR, Clean Claim Rate, Denial Rate, and Net Collection Rate show whether your practice is financially healthy
- Behavioral health and other specialty practices need extra metrics, such as prior authorization approval rates
- Consistent tracking paired with a dedicated billing partner turns unpredictable cash flow into steady, growing revenue
Why Tracking Revenue Cycle Metrics Matters
Revenue cycle management isn't one step. It's a chain of linked processes: Revenue cycle management isn't one step. It's a chain of linked processes:
- Scheduling
- Eligibility verification
- Coding
- Claim submission
- Payment posting
- Denial management
- Patient collections
Some practitioners call these the "7 steps of the revenue cycle." A break anywhere in that chain eventually shows up as lost revenue.
Without visibility into key performance indicators, practices can't tell whether a cash flow problem started at the front desk or in the back office. Is a claim denial happening because of an eligibility issue caught too late, or a coding error that a certified specialist would have flagged? You can't answer that without data.
Metrics also create accountability. When someone owns a specific number (denial rate, A/R days, first-pass resolution) that person or team has a clear target to hit. Without that ownership, revenue problems tend to become "everyone's problem," which in practice means no one's problem.
The 10 Revenue Cycle Metrics to Track
These 10 metrics span the entire revenue cycle, from the moment a claim is submitted to the moment the last dollar lands in your account. Tracking all 10, not just one or two favorites, gives you a complete financial picture instead of a partial one.
Days in Accounts Receivable (AR Days)
AR Days measures the average time it takes to collect payment after a claim is submitted.
Formula: Total AR ÷ Average Daily Revenue
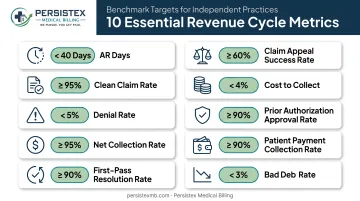
According to the Healthcare Financial Management Association, a healthy target sits between 30 and 40 days, with receivables older than 90 days ideally staying under 10% of total AR. If your practice is regularly seeing 50+ days, it's time to investigate:
- Slow payer processing times by carrier
- Gaps in staff follow-up cadence
- Delayed claim submission after the visit
Clean Claim Rate
This is the percentage of claims accepted by payers on the first submission, with no errors or rework needed.
Formula: Clean Claims ÷ Total Claims Submitted x 100
Industry benchmarks target 95% or higher, though top performers push closer to 98%. Persistex maintains a 98% clean claim rate across its client base by scrubbing and verifying every claim before it reaches a payer.
Claim Denial Rate
Denial rate tracks the percentage of claims a payer rejects outright.
Formula: Denied Claims ÷ Total Claims Submitted x 100
Common causes include:
- Coding errors and incorrect diagnosis-to-procedure linkage
- Missing or incomplete documentation
- Eligibility issues at the time of service
- Untimely filing or missing prior authorization
MGMA's 2023 DataDive Practice Operations report found an 8% aggregate first-submission denial rate among single-specialty groups, with a majority of practice leaders reporting rising denials year over year.
Keeping your rate below that range often comes down to coding expertise. Persistex's CPC-certified coders, with deep experience in behavioral health and specialty-specific coding, have helped clients cut coding-related denials by an average of 35%.
Net Collection Rate
Net Collection Rate (NCR) shows what you actually collected versus what you should have collected after contractual adjustments.
Formula: (Payments − Credits) ÷ (Charges − Approved Contractual Adjustments) x 100
A benchmark of 95% or higher is standard, with 97-99% considered strong performance. A low NCR is a red flag for underpayments, excessive write-offs, or denials that never got worked a second time.
First-Pass Resolution Rate
This metric captures the percentage of claims paid in full on the first submission, with zero follow-up required.
Practices aim for 90% or higher. First-pass resolution reflects the combined efficiency of three things working together:
- Accurate coding at the point of charge capture
- Thorough eligibility verification before the visit
- Claim scrubbing before submission
When this number is low, it usually means one of those three steps is breaking down somewhere upstream.
Claim Appeal Success Rate
This tracks the percentage of denied claims that get successfully overturned through appeal.
A strong benchmark is 80% or higher. AMA-reported KFF data found that 83.2% of appealed Medicare Advantage prior authorization denials were fully or partly overturned, yet only about 1 in 10 denied requests ever got appealed.
That gap matters: persistent, well-documented appeals recover revenue that would otherwise be written off. Persistex's appeals process exceeds 72% success by pairing root cause analysis with multi-level follow-up.
Cost to Collect
Cost to Collect measures how much you spend to bring in a dollar of revenue.
Formula: Total Revenue Cycle Operating Costs ÷ Total Collections
Industry estimates place typical billing and RCM costs around 5% of collections. Outsourcing specialized functions like coding or denial management often lowers this ratio, since certified specialists resolve issues faster than generalist in-house staff juggling multiple roles.
Prior Authorization Approval Rate
This measures the percentage of prior authorization requests approved before treatment begins. It matters especially for behavioral health and other services that require payer approval up front.
Every delay or denial blocks revenue before care starts. Strong programs treat initial requests, medical-necessity documentation, peer-to-peer reviews, and re-authorizations as one continuous process. Persistex maintains a 95% prior authorization approval rate by managing that full sequence end to end.
Patient Payment Collection Rate
This tracks the percentage of patient-owed balances your practice successfully collects, whether at the point of service or through later billing.
As patient financial responsibility keeps growing, this metric matters more each year. Transparent pricing and real-time eligibility checks help patients know what they owe before they leave. Pair that with clear statements and a consistent follow-up cadence to lift collection outcomes.
Bad Debt Rate
Bad Debt Rate shows the percentage of billed revenue written off as uncollectable.
Formula: Total Bad Debt ÷ Total Service Revenue
A benchmark under 5% is considered healthy. A rising bad debt rate usually points to gaps in upfront eligibility verification or unclear communication with patients about what they owe and when it's due.
Specialty Considerations for Behavioral Health and TMS Practices
Behavioral health practices run on volume and frequency. A single patient might generate 20+ claims a year through weekly therapy sessions. Delayed billing on any one of those sessions compounds fast. A two-week lag on session-to-claim submission across dozens of patients can balloon your AR days before anyone notices.
TMS providers face a different layer of complexity. CPT codes 90867, 90868, and 90869 each apply to distinct phases of treatment:
- 90867 covers initial planning and can typically be billed only once per treatment episode
- 90868 applies to subsequent treatment sessions
- 90869 covers motor threshold re-determination and cannot be billed alongside 90867 or 90868
Getting these wrong, or missing required modifiers, is one of the fastest ways to trigger denials in a TMS practice. Coding accuracy and prior authorization tracking deserve extra attention here.
Generic billing benchmarks don't always translate cleanly to these specialties. A 30-40 day AR benchmark built from general outpatient data may not reflect a practice managing weekly recurring sessions and payer-specific authorization rules. Where possible, compare your numbers against specialty-specific data instead of industry-wide averages.
Building a Simple Revenue Cycle Dashboard
You don't need to track 30 metrics to run a healthy revenue cycle. Trying to do so usually backfires: staff get overwhelmed, and nothing actually gets acted on.
Stick to the 8-10 metrics that matter most. From there, set a review cadence:
- Weekly: Claim denials, A/R follow-up on aging accounts
- Monthly: Net collection rate, cost to collect, bad debt rate
- Quarterly: Days in A/R trends, clean claim rate, payer mix shifts
A dashboard full of numbers means nothing without ownership. Assign each metric an owner: a billing manager, practice administrator, or outsourced billing partner. Build a recurring review where those numbers get discussed and acted on—not glanced at once a month and filed away.
How Persistex Helps Practices Improve These Metrics
Tracking these metrics is one thing. Actually moving them requires staffing and specialty expertise that many practices simply don't have in-house — the gap a dedicated billing partner is built to fill.
Persistex takes a different approach than the call-center billing model most practices are used to:
- Dedicated named account teams who know your practice and specialty, reachable directly instead of through a ticket queue
- 99.2% coding accuracy from CPC-certified coders trained in behavioral health and outpatient specialty coding
- Proven results — AR days cut from 90 to 30 and 40% fewer denied claims for behavioral health and specialty practice clients
One multi-provider behavioral health clinic came to Persistex with a 35% denial rate and inconsistent cash flow. Within months, denials dropped 40%, average AR fell to 22 days, and the clinic added $85,000 in monthly revenue.

If you're not sure where your practice stands against these benchmarks, a free revenue cycle assessment can show you exactly where the gaps are — and what fixing them could be worth.
Frequently Asked Questions
What are the 7 steps of the revenue cycle?
The core stages are patient registration and scheduling, eligibility verification, charge capture and coding, claim submission, payment posting, denial management and A/R follow-up, and patient collections.
What are some revenue KPIs?
Widely used KPIs include Days in A/R, Clean Claim Rate, Denial Rate, and Net Collection Rate. Each has a standard formula and industry benchmark you can track over time.
How often should a practice review its revenue cycle metrics?
Review fast-moving metrics like denials and A/R follow-up weekly. Save broader indicators, such as net collection rate and cost to collect, for a monthly deep dive.
What is a good clean claim rate for a small practice?
95% or higher is the industry benchmark. Top-performing practices, including Persistex's client base, achieve 98% or better.
Can outsourcing medical billing actually improve these metrics?
Specialized billing partners add certified coders, dedicated follow-up, and denial expertise most in-house teams lack. Practices often see measurable gains in A/R days and collections within 30–60 days.
What's the difference between gross and net collection rate?
Gross collection rate compares payments to full billed charges, ignoring contractual adjustments. Net collection rate accounts for those adjustments, making it the more accurate measure of billing performance.