
A denial rate that dropped from 11% to 9% feels like progress on a monthly dashboard. But if the real benchmark for your specialty sits at 5-7%, you're still leaving revenue on the table every single month.
Rising denials, staffing shortages, and inflation are squeezing practice margins right now. In a March 2024 MGMA poll of 235 medical-group leaders, 60% reported higher claim-denial rates than the same period in 2023. Only 11% saw improvement.
This guide breaks down the five KPIs that define revenue cycle health, the benchmarks that actually apply to outpatient practices, and how those numbers shift for specialty groups like behavioral health and TMS therapy clinics.
Key Takeaways
- Days in A/R, Clean Claim Rate, Net Collection Rate, Denial Rate, and Cost to Collect are the core RCM scorecard
- Benchmarks shift by specialty and practice size—industry averages can mask real problems
- Month-over-month comparisons alone hide gaps that external benchmarking reveals
- Behavioral health practices face authorization and documentation hurdles that drive higher denial rates
- Closing a benchmark gap starts with root-cause denial analysis, not another dashboard
What Are RCM KPIs and Why Benchmarking Beats Self-Comparison
Revenue cycle management KPIs are the metrics finance teams use to measure how efficiently a practice captures, tracks, and collects revenue for services already rendered. They tell you whether the money you earned is actually landing in your bank account, and how long that takes.
Here's the trap most practices fall into: they track trends, not benchmarks.
The internal benchmark trap works like this. A denial rate improving from 11% to 9% looks like a win on paper. But without knowing the specialty benchmark, that improvement could still represent thousands of dollars in avoidable losses every month.
Given that most medical groups are currently reporting denial rates trending upward, not downward, a small internal gain can mean you're simply losing money more slowly than your peers.
Every KPI worth tracking falls into one of four buckets:
- Patient access and eligibility — verification accuracy, authorization turnaround
- Claims management — clean claim rate, first-pass acceptance
- Accounts receivable and collections — days in A/R, net collection rate
- Financial integrity — cost to collect, denial rate by root cause
Understanding which bucket a KPI belongs to matters because it tells you where the fix lives. A denial problem rooted in eligibility isn't solved by hiring better coders.
The Essential Healthcare RCM KPIs and Industry Benchmarks
These five metrics form the backbone of any revenue cycle scorecard. Track them together, not in isolation. A strong number in one area can mask a weak one elsewhere.
Days in Accounts Receivable (A/R)
Formula: Total A/R ÷ Average Daily Net Patient Service Revenue
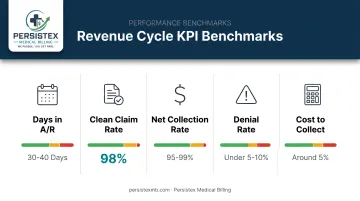
This measures how many days, on average, it takes to collect payment after a service is delivered. HFMA sets the standard target at 30-40 days, with high-performing practices staying under 35 days.
A rising Days in A/R number signals:
- Slower claims processing or submission delays
- Staffing gaps in billing or follow-up
- Payer-side delays or increased pended claims
HFMA also recommends keeping A/R over 90 days below 10% of total receivables. Anything higher suggests claims are stalling in appeals or follow-up queues instead of moving toward resolution.
Clean Claim Rate (CCR)
Formula: Clean Claims ÷ Total Claims Submitted
A "clean" claim is one that processes without needing manual correction or additional documentation, per CMS's definition. HFMA points to a 98% clean claim target as the benchmark providers should aim for.
Falling short of that isn't just a claims-submission problem. A low CCR usually points to front-end issues: incomplete eligibility checks, missing authorizations, or coding errors that surface only after submission.
Net Collection Rate
Formula: Payments Received ÷ Charges After Contractual Adjustments
This is the truest measure of whether you're collecting what you're actually owed, not what you billed. HFMA cites 95% as the minimum acceptable rate, with 97-99% considered optimal.
Net collection rate differs from gross collection rate because it accounts for contractual write-offs. Tracking it by payer type matters. A strong overall number can hide chronic underpayment from one or two carriers.
Denial Rate
Formula: Denied Claims ÷ Total Claims Submitted
AAPC guidance suggests under 10% is acceptable, with under 5% representing a stronger target. But the rate alone tells you almost nothing about what to fix.
Segment denials by root cause:
- Eligibility: coverage lapsed or wasn't verified
- Coding: mismatched diagnosis-to-procedure linkage
- Authorization: missing or expired prior auth
The category matters more than the percentage. Two practices with an 8% denial rate can need completely different fixes.
Cost to Collect
Formula: Total RCM Expenses ÷ Total Collections
This tells you how much it costs to bring in each dollar of revenue. MGMA's 2025 reporting places typical billing and RCM costs around 5% of collections, whether staffed in-house or outsourced.
Calculate this accurately by including:
- Billing and coding staff salaries (or outsourced fees)
- Technology and clearinghouse costs
- Patient access and eligibility-verification labor
- Denial management and appeals time
RCM Benchmarks by Practice Type: Behavioral Health, TMS, and General Practices
A denial rate that's excellent for a family medicine practice can be mediocre for a behavioral health clinic. Specialty and size both shift what "good" means.
Behavioral Health's Unique Pressure Points
Behavioral health practices routinely face denial drivers that general practices rarely see:
- Session-limit denials once a patient exceeds authorized visit counts
- Heavier documentation requirements tied to medical necessity
- Frequent re-authorizations and peer-to-peer reviews for ongoing therapy
These factors push denial rates above general-practice averages even when billing is executed correctly. Those gaps are usually structural, not a sign of sloppy billing.
TMS Therapy's Coding Complexity
TMS therapy billing carries its own layer of difficulty. CPT codes 90867-90869 each apply to a different phase of treatment, and using the wrong one (or missing a required modifier) triggers denials fast.
Prior auth is equally unforgiving: payers expect the right clinical documentation before treatment starts. Practices that wait until a denial arrives usually watch approval rates and start-of-care timelines slip together.
Size Changes the Math Too
Solo practitioners typically carry higher Days in A/R and a higher cost to collect than multi-provider clinics, largely because there's no dedicated staff chasing down denials between patient visits. A single physician handling billing between appointments simply can't match the follow-up cadence of a clinic with dedicated administrative support.
Rather than relying on one industry-wide number, build (or request from your billing partner) a benchmark table segmented by specialty and provider count. A blended outpatient average will not guide a solo psychiatry practice or a TMS center.
The 7 Steps of the Revenue Cycle and Where KPIs Fit
KPIs aren't standalone numbers — each one is a checkpoint tied to a specific phase of the billing process. The revenue cycle is commonly broken into seven steps:
- Pre-registration/eligibility verification — confirming coverage before the visit
- Registration — capturing accurate patient and insurance data
- Charge capture — documenting services rendered
- Coding — translating documentation into billable CPT/ICD-10 codes
- Claims submission — sending clean claims to payers
- Payment posting — recording what's actually paid
- Denial management/collections — resolving what's rejected or underpaid
Map KPIs to each stage and the connections become obvious:
- Eligibility verification failures show up later as denial rate spikes
- Coding errors surface as low clean claim rates
- Slow payment posting inflates Days in A/R even when claims process fine
Some frameworks expand this into 10-16 granular steps, breaking registration or coding into finer sub-tasks. For most practices, though, the seven-step model remains the clearest shorthand for spotting where a KPI problem actually originates.
How to Close the Gap When Your KPIs Miss Benchmark
Missing a benchmark is diagnostic data, not a dead end. These five fixes close the gap most often.
1. Segment denials by root cause, not just rate. Tracking "9% denial rate" tells you almost nothing. Breaking it into eligibility, coding, and authorization categories tells you exactly which team or process needs attention.
2. Invest in front-end workflows. A large share of collection gaps trace back to registration and intake, not claims submission. Real-time eligibility checks before every appointment catch coverage issues before they become denials.
3. Automate claim scrubbing and audit coding regularly. Catching errors before submission is far cheaper than fixing them after a denial. Periodic coding audits also catch drift before it becomes a pattern.
4. Consider specialty-specific outsourcing for niche billing. Practices without in-house coding depth, particularly behavioral health clinics, often close benchmark gaps faster with a specialized partner. Persistex clients have seen:
- 40% average reduction in denied claims
- A/R days cut from 90 down to 30
- 98% clean claim rate maintained across all clients
- $125,000 average monthly collections boost

5. Re-benchmark quarterly, not just monthly. Comparing this month to last month catches short-term slips. Comparing against updated industry benchmarks each quarter catches the slower, more damaging drift that month-over-month tracking misses entirely.
Frequently Asked Questions
What are the 7 steps of the revenue cycle?
The commonly referenced model includes pre-registration/eligibility verification, registration, charge capture, coding, claims submission, payment posting, and denial management/collections. Each step feeds directly into the next.
What are the key performance indicators (KPIs) for revenue cycle management?
The five core KPIs are Days in A/R, Clean Claim Rate, Net Collection Rate, Denial Rate, and Cost to Collect. Track each against an external benchmark, not just your own historical trend.
What are the four Ps of revenue cycle management?
This framework is sometimes described as Patient, Provider, Payer, and Process/Payment: the four parties or stages that shape how efficiently revenue moves through the cycle. It is more of a teaching tool than a formal industry standard.
What is a good denial rate benchmark for medical practices?
Under 5% is a strong target; under 10% is generally acceptable. Specialty context matters: behavioral health and other authorization-heavy practices often run higher.
How often should practices review RCM KPIs against benchmarks?
Monthly internal tracking catches short-term issues, while quarterly comparisons against updated industry benchmarks reveal longer-term performance gaps. Relying on just one cadence leaves blind spots.
Can outsourcing RCM help a practice meet its KPI benchmarks faster?
Specialized RCM partners bring coding expertise and dedicated denial follow-up that often accelerates benchmark improvement. That edge is clearest in niches like behavioral health, where generic billing knowledge often falls short.